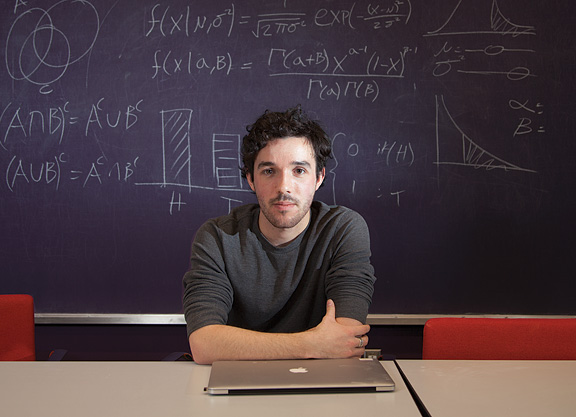
Daniel Kunin knows there are better ways to teach math than through textbooks. His website, Seeing Theory, presents interactive visualizations that help explain basic concepts in statistics. It teaches probability, for instance, by flipping a virtual coin, allowing viewers to see the difference between theoretical probability (always fifty percent) and actual results (varying).

“It was the same old thing that people see in the textbook,” Kunin says. “But what’s new is that people could manipulate and change the diagram and input their own numbers—it was taking a static concept and making it dynamic.”
The Venn diagram became the first of ten concepts that Kunin and his friend, Tyler Devlin ’17, developed on Seeing Theory. In his junior year, Kunin received a Royce Fellowship, which provided him with the resources to pursue the website.
“With each concept,” Kunin says, “there’s only so much you can change visually—the colors, the shapes, the size, the opacity—and we try and figure out how we can use those properties to reflect a change in a data set. ”
Hoping to receive some feedback on his work, Kunin reached out to some prominent math bloggers and data scientists. After one of them tweeted about Kunin’s site, it trended on the front page of Reddit. In a period of a few months this year, Seeing Theory went viral. According to Kunin, the site received more than a million views in March. Not bad for a website about statistics. “Daniel will be famous one day,” says Kerrissa Heffernan, director of the Royce Fellowship program.
Kunin reports that his site has a 40 percent return rate, which, he says, indicates that the visitors are coming back for guidance rather than just checking it out as a novelty. So far, he’s gotten requests to translate the content into Chinese, Spanish, Hungarian, Norwegian, and Italian.
This fall, along with starting graduate school at Stanford, he’ll continue working with his partners to improve the Seeing Theory site. He’s also publishing an article in the American Statistics Journal to share his approach to statistical visualization with high school teachers. He hopes schools will continue to adopt and incorporate his approach.
“Seeing Theory is about making statistics more accessible to a wider range of learners,” Kunin says. “We want to create a supplementary resource for high school and college students, or anyone interested in statistics in general.”


